Introduction
pgwatch2 is a flexible PostgreSQL-specific monitoring solution, relying on Grafana dashboards for the UI part. It supports monitoring of almost all metrics for Postgres versions 9.0 to 13 out of the box and can be easily extended to include custom metrics. At the core of the solution is the metrics gathering daemon written in Go, with many options to configure the details and aggressiveness of monitoring, types of metrics storage and the display the metrics.
Quick start with Docker
For the fastest setup experience Docker images are provided via Docker Hub (if new to Docker start here). For custom setups see the Custom installations paragraph below or turn to the pre-built DEB / RPM / Tar packages on the Github Releases page.
Launching the latest pgwatch2 Docker image with built-in InfluxDB metrics storage DB:
# run the latest Docker image, exposing Grafana on port 3000 and the administrative web UI on 8080
docker run -d -p 3000:3000 -p 8080:8080 -e PW2_TESTDB=true --name pw2 cybertec/pgwatch2
After some minutes you could for example open the “DB overview” dashboard and start looking at metrics in Grafana. For defining your own dashboards or making changes you need to log in as admin (default user/password: admin/pgwatch2admin).
NB! If you don’t want to add the “test” database (the pgwatch2 configuration DB holding connection strings to monitored DBs and metric definitions) to monitoring, remove the PW2_TESTDB env variable.
Also note that for long term production usage with Docker it’s highly recommended to use separate volumes for each pgwatch2 component - see here for a better launch example.
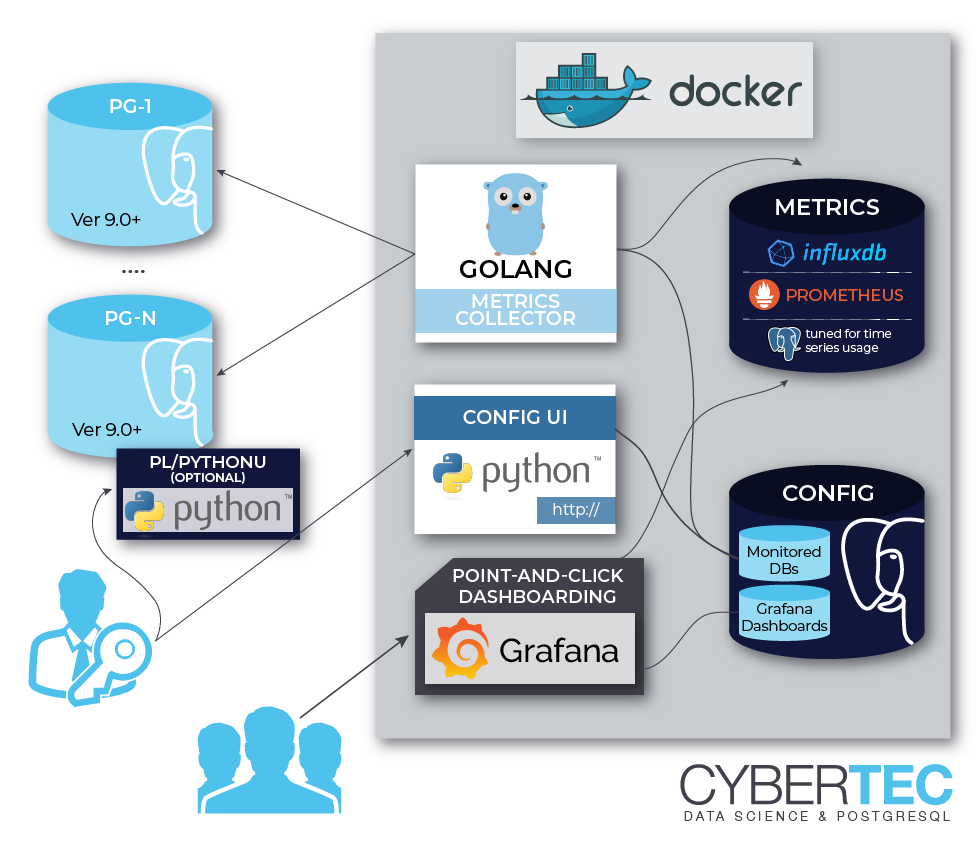
Typical “pull” architecture
To get an idea how pgwatch2 is typically deployed a diagram of the standard Docker image fetching metrics from a set of Postgres databases configured via a configuration DB:
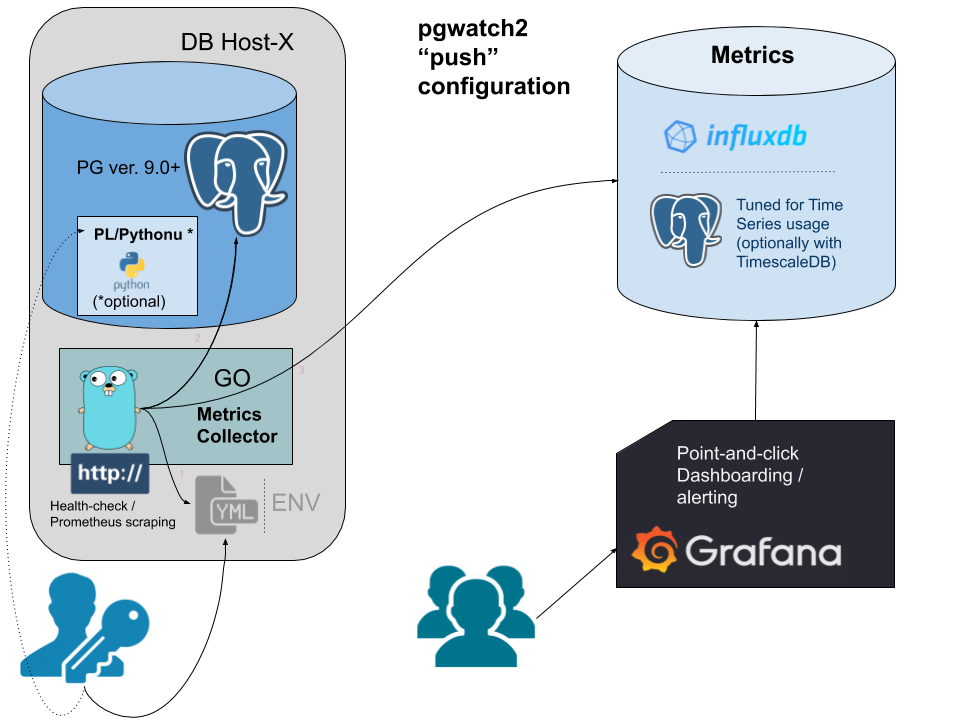
Typical “push” architecture
A better fit for very dynamic (Cloud) environments might be a more de-centralized “push” approach or just exposing the metrics over a port for remote scraping. In that case the only component required would be the pgwatch2 metrics collection daemon.