Components
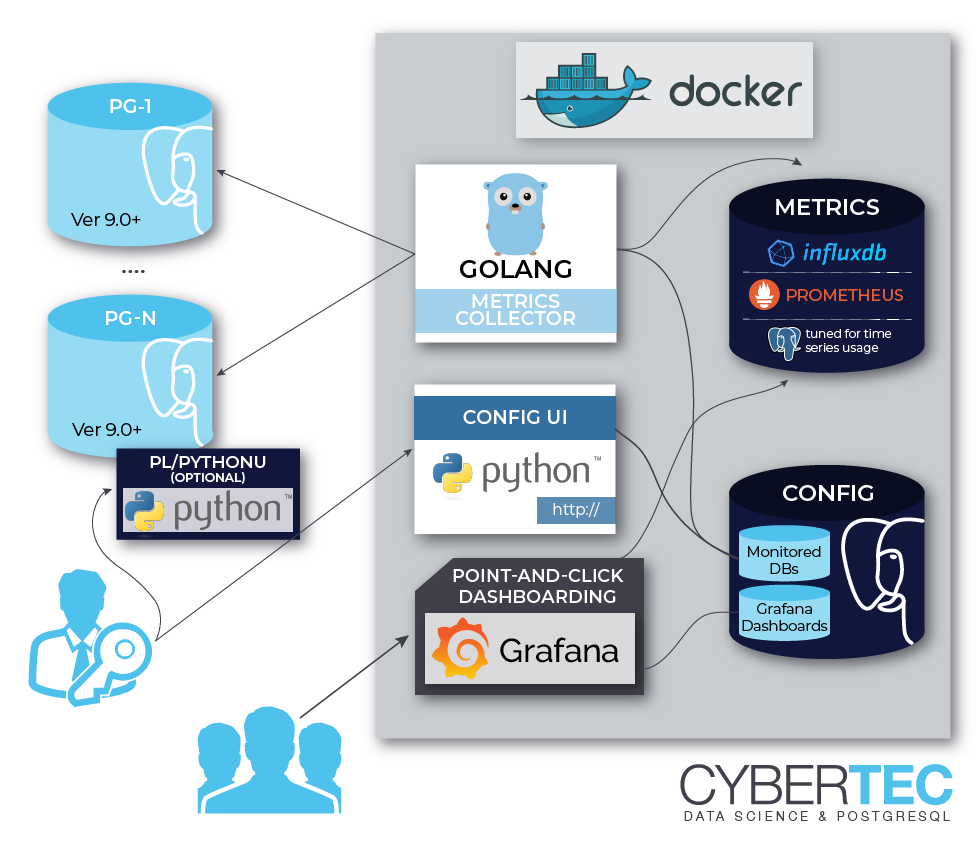
The main development idea around pgwatch2 was to do the minimal work needed and not to reinvent the wheel - meaning that pgwatch2 is mostly just about gluing together already some proven pieces of software for metrics storage and using Grafana for dashboarding. So here a listing of components that can be used to build up a monitoring setup around the pgwatch2 metrics collector. Note that most components are not mandatory and for tasks like metrics storage there are many components to choose from.
The metrics gathering daemon
The metrics collector, written in Go, is the only mandatory and most critical component of the whole solution. The main task of the pgwatch2 collector / daemon is pretty simple - reading the configuration and metric defintions, fetching the metrics from the configured databases using the configured connection info and finally storing the metrics to some other database, or just exposing them over a port for scraping in case of Prometheus mode.
Configuration store
The configuration says which databases, how often and with which metrics (SQL-s queries) are to be gathered. There are 3 options to store the configuration:
- A PostgreSQL database holding a simple schema with 5 tables.
- File based approach - YAML config file(s) and SQL metric definition files.
- Purely ENV based setup - i.e. an “ad-hoc” config to monitor a single database or the whole instance. Bascially just a connect string (JDBC or Libpq type) is needed which is perfect for “throwaway” and Cloud / container usage.
Metrics storage DB
Many options here so that one can for example go for maximum storage effectiveness or pick something where they already know the query language:
InfluxDB Time Series Database
InfluxDB is specifically designed for storing metrics so it’s disk footprint is much smaller compared to PostgreSQL but downsides are the limited query capabilities and higher hardware (CPU / RAM) requirements - see the Sizing recommendations chapter for more details.
PostgreSQL - world’s most advanced Open Source RDBMS
Postgres storage is based on the JSONB datatype so minimally version 9.4+ is required, but for bigger setups where partitioning is a must, v11+ is needed. Any already existing Postgres database will do the trick, see the Bootstrapping the Metrics DB section for2 details.
TimescaleDB time-series extension for PostgreSQL
Although technically a plain extension it’s often mentioned as a separate database system as it brings custom data compression to the table, enabling huge disk savings over standard Postgres. Note that pgwatch2 does not use Timescale’s built-in retention management but a custom version.
Prometheus Time Series DB and monitoring system
Though Prometheus is not a traditional database system, it’s a good choice for monitoring Cloud-like environments as the monitoring targets don’t need to know too much about how actual monitoring will be carried out later and also Prometheus has a nice fault-tolerant alerting system for enterprise needs. NB! By default Prometheus is not set up for long term metrics storage!
Graphite Time Series DB
Not as modern as the other options but a performant TSDB nevertheless with built-in charting. In pgwatch2 use case though there’s no support for “custom tags” and request batching support which should not be a big problem for lighter use cases.
JSON files
Plain text files for testing / special use cases.
The Web UI
The second homebrewn component of the pgwatch2 solution is an optional and relatively simple Web UI for administering details of the monitoring configuration like which databases should be monitored, with which metrics and intervals. Besides that there are some basic overview tables to analyze the gathered data and also possibilities to delete unneeded metric data (when removing a test host for example).
NB! Note that the Web UI can only be used if storing the configuration in the database (Postgres).
Metrics representation
Standard pgwatch2 setup uses Grafana for analyzing the gathered metrics data in a visual, point-and-click way. For that a rich set of predefined dashboards for Postgres and InfluxDB data sources is provided, that should cover the needs of most users - advanced users would mostly always want to customize some aspects though, so it’s not meant as a one-size-fits-all solution. Also as metrics are stored in a DB, they can be visualized or processed in any other way.
Component reuse
NB! All components are loosely coupled, thus for non-pgwatch2 components (pgwatch2 components are only the metrics collector and the optional Web UI) you can decide to make use of an already existing installation of Postgres, Grafana or InfluxDB and run additionally just the pgwatch2 collector.
To use an existing Postgres DB for storing the monitoring config
Create a new pgwatch2 DB, preferrably also an accroding role who owns it. Then roll out the schema (pgwatch2/sql/config_store/config_store.sql) and set the following parameters when running the image: PW2_PGHOST, PW2_PGPORT, PW2_PGDATABASE, PW2_PGUSER, PW2_PGPASSWORD, PW2_PGSSL (optional).
To use an existing Grafana installation
Load the pgwatch2 dashboards from grafana_dashboard folder if needed (one can totally define their own) and set the following paramater: PW2_GRAFANA_BASEURL. This parameter only provides correct links to Grafana dashboards from the Web UI. Grafana is the most loosely coupled component for pgwatch2 and basically doesn’t have to be used at all. One can make use of the gathered metrics directly over the Influx (or Graphite) API-s.
To use an existing InfluxDB installation
Set the following env variables: PW2_IHOST, PW2_IPORT, PW2_IDATABASE, PW2_IUSER, PW2_IPASSWORD, PW2_ISSL (optional).
NB! Note that if wanting to use SSL with self-signed certificates on InfluxDB side then some extra steps described in this Github issue are needed.
To use an existing Graphite installation
One can also store the metrics in Graphite instead of InfluxDB (no predefined pgwatch2 dashboards for Graphite though). Following parameters needs to be set then: PW2_DATASTORE=graphite, PW2_GRAPHITEHOST, PW2_GRAPHITEPORT
To use an existing Postgres DB for storing metrics
- Roll out the metrics storage schema according to instructions from here.
- Following parameters need to be set for the gatherer:
--datastore=postgresorPW2_DATASTORE=postgres--pg-metric-store-conn-str="postgresql://user:pwd@host:port/db"orPW2_PG_METRIC_STORE_CONN_STR="..."- optionally also adjust the
--pg-retention-daysparameter. By default 30 days for InfluxDB and 14 days for Postgres are kept
- If using the Web UI also set the datastore parameters
--datastoreand--pg-metric-store-conn-strif wanting to have an option to be able to clean up data also via the UI in a more targeted way.
NB! When using Postgres metrics storage, the schema rollout script activates “asynchronous commiting” feature for the pgwatch2 role in the metrics storage DB by default! If this is not wanted (no metrics can be lost in case of a crash), then re-enstate normal (synchronous) commiting with below query and restart the pgwatch2 agent:
ALTER ROLE pgwatch2 IN DATABASE $MY_METRICS_DB SET synchronous_commit TO on;