The Admin Web UI
If using pgwatch2 in the centrally managed Config DB way, for easy configuration management (adding databases to monitoring, adding metrics) there is a small Python Web application bundled making use of the CherryPy Web-framework.
For mass configuration changes the Web UI has some buttons to disable / enable all hosts for example, but one could technically also log into the configuration database and change the pgwatch2.monitored_db table directly.
Besides managing the metrics gathering configurations, the two other useful features for the Web UI would be the possibility to look at the logs of the single components and to verify that metrics gathering is working on the “Stat Statements Overview” page, which will contact the metrics DB (only Postgres and InfluxDB supported) and present some stats summaries.
Default port: 8080
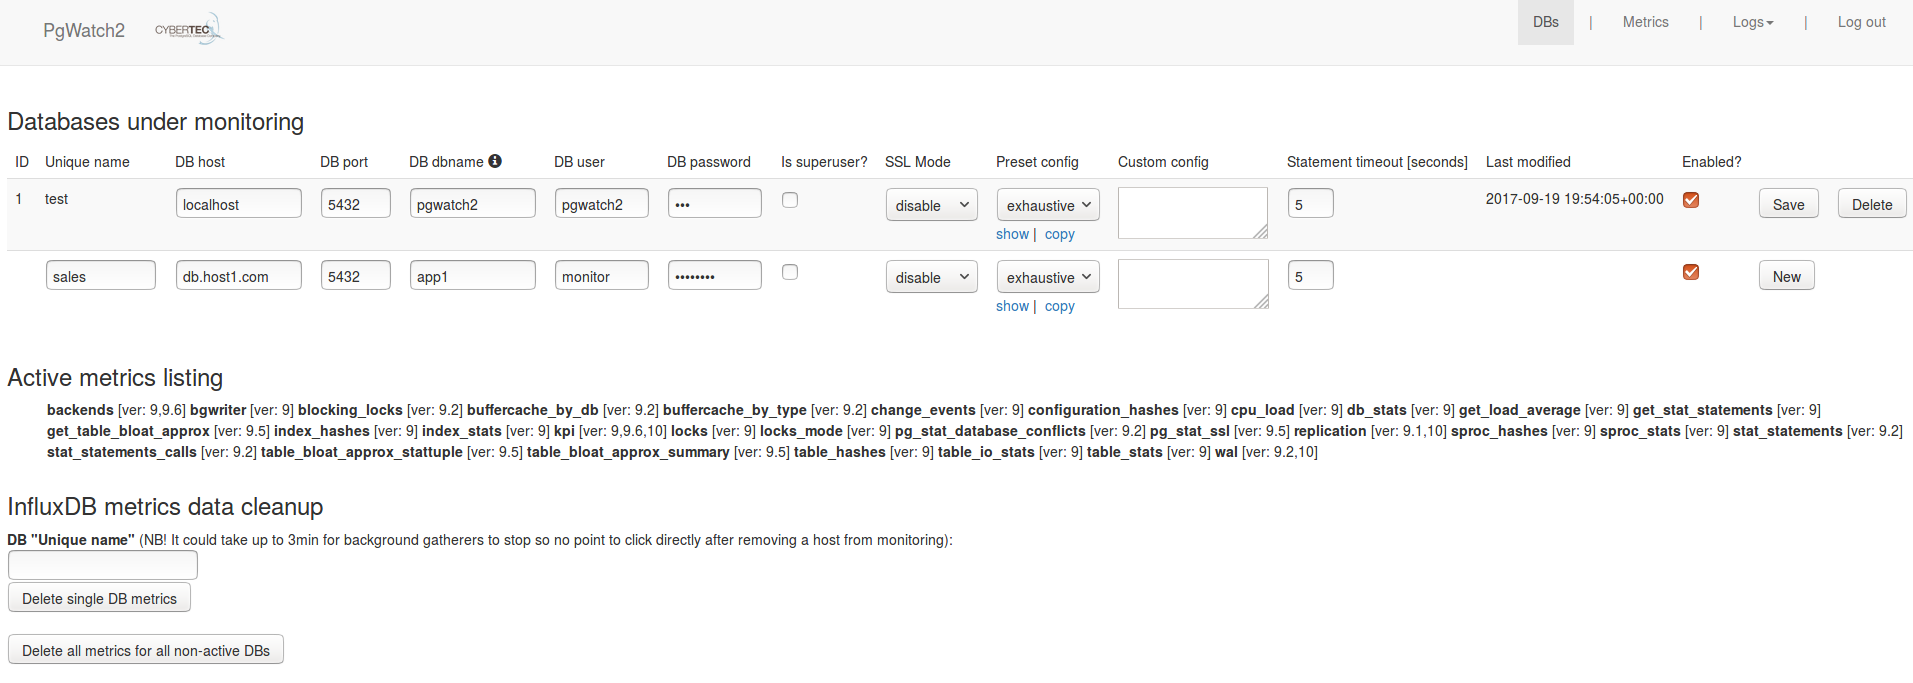
Sample screenshot of the Web UI:
Web UI security
By default the Web UI is not secured - anyone can view and modify the monitoring configuration. If some security is needed though it can be enabled:
HTTPS
--ssl, --ssl-cert, --ssl-key, --ssl-certificate-chainorPW2_WEBSSL, PW2_WEBCERT, PW2_WEBKEY, PW2_WEBCERTCHAINPassword protection
--no-anonymous-access, --admin-user, --admin-passwordorPW2_WEBNOANONYMOUS, PW2_WEBUSER, PW2_WEBPASSWORDHiding some possibly sensitive information
--no-component-logs, --no-stats-summaryorPW2_WEBNOCOMPONENTLOGS, PW2_WEBNOSTATSSUMMARYPassword encryption for the role used for fetching metrics
--aes-gcm-keyphrase, --aes-gcm-keyphrase-fileorPW2_AES_GCM_KEYPHRASE, PW2_AES_GCM_KEYPHRASE_FILENote that standard LibPQ .pgpass files can also be used so there’s no requirement to store any passwords in pgwatch2 config DB. Also note that when enabling password encryption, the same key needs to be presented also for the gatherer.
NB! For security sensitive environments make sure to always deploy password protection together with SSL, as it uses a standard cookie based techniques vulnerable to snooping / MITM attacks.
Exposing the component logs
When using the Docker images, internal component logs (Postgres, Influx, Grafana, Go daemon, Web UI itself) are exposed via the “/logs” endpoint. If this is not wanted set the PW2_WEBNOCOMPONENTLOGS env. variable. Note that if a working “/logs” endpoint is desired also in custom setup mode (non-docker) then some actual code changes are needed to specify where logs of all components are situated - see top of the pgwatch2.py file for that.