Attention
This documentation pertains to older v2.x releases. Many features and functions have since been updated or replaced. Please refer to the current version for the latest information.
Advanced features
Over the years the core functionality of fetching metrics from a set of plain Postgres DB-s has been extended in many ways to cover some common problem areas like server log monitoring and supporting monitoring of some other popular tools often used together with Postgres, like the PgBouncer connection pooler for example.
Patroni support
Patroni is a popular Postgres specific HA-cluster manager that makes node management simpler than ever, meaning that everything is dynamic though - cluster members can come and go, making monitoring in the standard way a bit tricky. But luckily Patroni cluster members information is stored in a DCS (Distributed Consensus Store), like etcd, so it can be fetched from there periodically.
When ‘patroni’ is selected as DB type then the usual Postgres host/port fields should be left empty (“dbname” can still filled if only a specific single database is to be monitored) and instead “Host config” JSON field should be filled with DCS address, type and scope (cluster name) information. A sample config (for Config DB based setups) looks like:
{
  "dcs_type": "etcd",
  "dcs_endpoints": ["http://127.0.0.1:2379"],
  "scope": "batman",
  "namespace": "/service/"
}
For YAML based setups an example can be found from the instances.yaml file.
NB! If Patroni is powered by etcd, then also username, password, ca_file, cert_file, key_file optional security parameters can be defined - other DCS systems are currently only supported without authentication.
Also if you don’t use the standby nodes actively for queries then it might make sense to decrease the volume of gathered metrics and to disable the monitoring of such nodes with the “Master mode only?” checkbox (when using the Web UI) or with only_if_master=true if using a YAML based setup.
Log parsing
As of v1.7.0 the metrics collector daemon, when running on a DB server (controlled best over a YAML config), has capabilities to parse the database server logs for errors. Out-of-the-box it will though only work when logs are written in CSVLOG format. For other formats user needs to specify a regex that parses out named groups of following fields: database_name, error_severity. See here for an example regex.
NB! Note that only the event counts are stored, no error texts, usernames or other infos! Errors are grouped by severity for the monitored DB and for the whole instance. The metric name to enable log parsing is “server_log_event_counts”. Also note that for auto-detection of log destination / setting to work, the monitoring user needs superuser / pg_monitor privileges - if this is not possible then log settings need to be specified manually under “Host config” as seen for example here.
Sample configuration if not using CSVLOG logging:
On Postgres side (on the monitored DB)
# Debian / Ubuntu default log_line_prefix actually
log_line_prefix = '%m [%p] %q%u@%d '
YAML config (recommended when “pushing” metrics from DB nodes to a central metrics DB)
## logs_glob_path is only needed if the monitoring user is cannot auto-detect it (i.e. not a superuser / pg_monitor role)
# logs_glob_path:
logs_match_regex: '^(?P<log_time>.*) \[(?P<process_id>\d+)\] (?P<user_name>.*)@(?P<database_name>.*?) (?P<error_severity>.*?): '
NB! For log parsing to work the metric server_log_event_counts needs to be enabled or a preset config including it used - like the “full” preset.
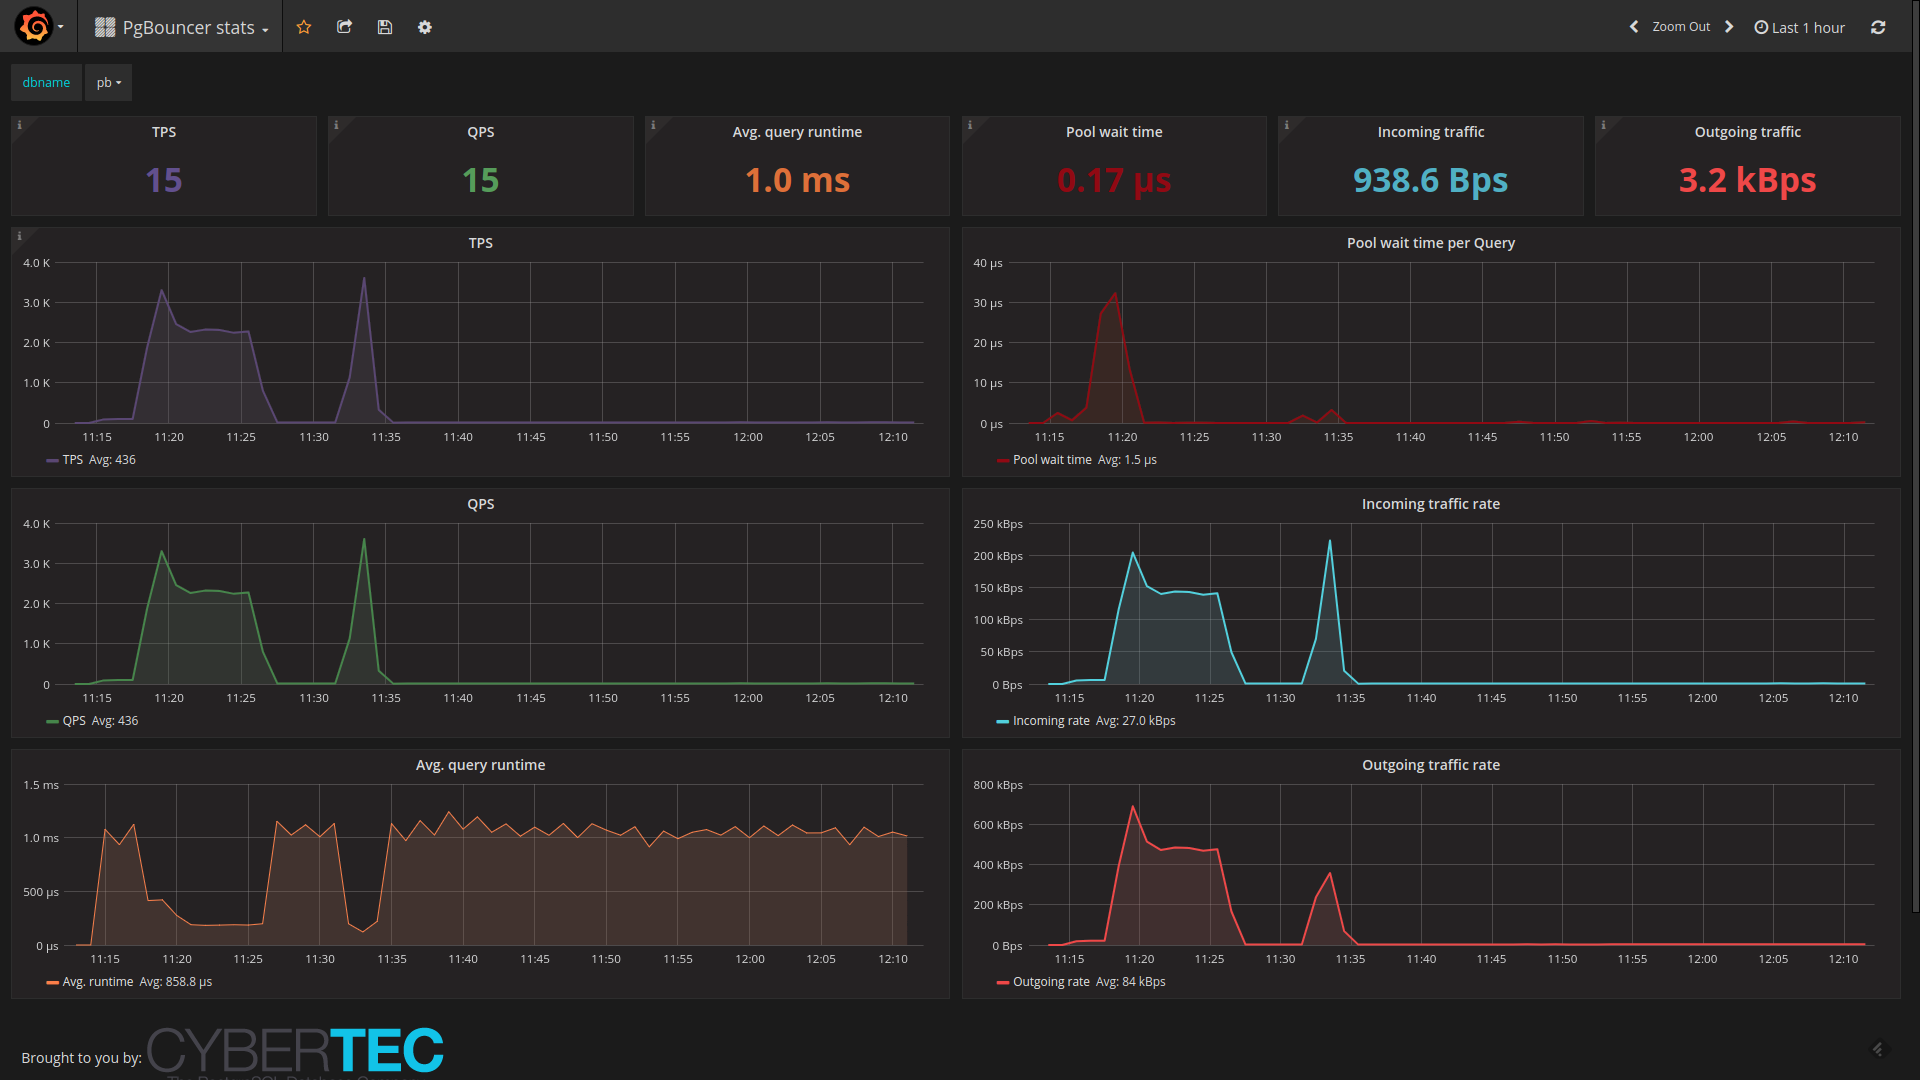
PgBouncer support
Pgwatch2 also supports collecting internal statistics from the PgBouncer connection pooler, via the built-in special
“pgbouncer” database and the SHOW STATS command. To enable it choose the according DB Type, provide connection
info to the pooler port and make sure the pgbouncer_stats metric or “pgbouncer” preset config is selected for the host.
Note that for the “DB Name” field you should insert not “pgbouncer” (although this special DB provides all the statistics)
but the real name of the pool you wish to monitor or leave it empty to track all pools. In latter case individual pools
will be identified / separated via the “database” tag.
There’s also a built-in Grafana dashboard for PgBouncer data, looking like that:
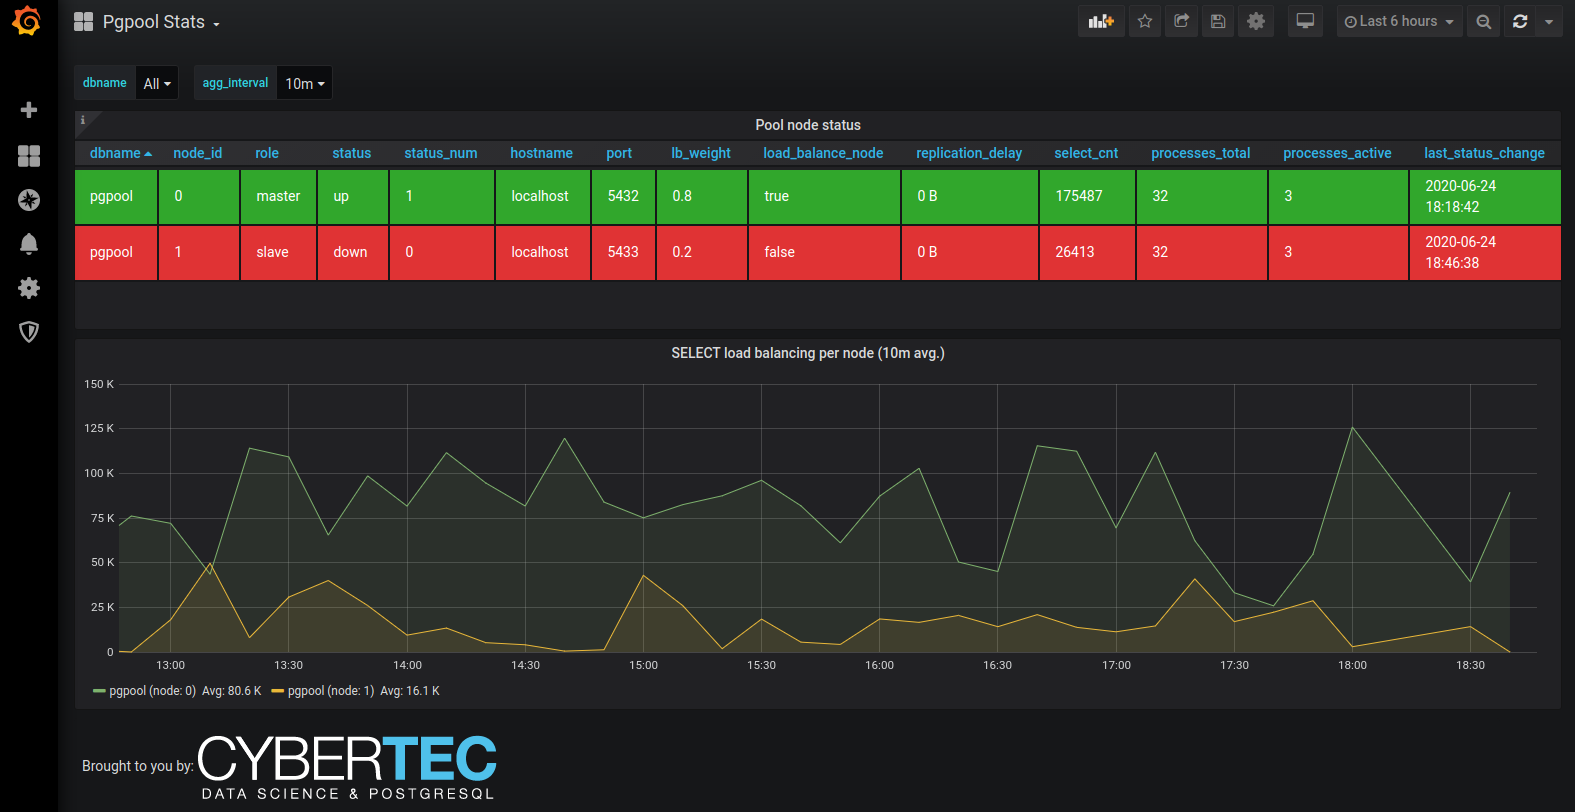
Pgpool-II support
Quite similar to PgBouncer, also Pgpool offers some statistics on pool performance and status, which might be of interest especially if using the load balancing features. To enable it choose the according DB Type, provide connection info to the pooler port and make sure the pgpool_stats metric / preset config is selected for the host.
The built-in Grafana dashboard for Pgpool data looks something like that:
Prometheus scraping
pgwatch2 was originally designed with direct metrics storage in mind, but later also support for externally controlled Prometheus scraping was added. Note that currently though the storage modes are exclusive, i.e. when you enable the Promotheus endpoint (default port 9187) there will be no direct metrics storage.
To enable the scraping endpoint set --datastore=prometheus and optionally also --prometheus-port, --prometheus-namespace,
--prometheus-listen-addr. Additionally note that you still need to specify some metrics config as usually - only metrics with
interval values bigger than zero will be populated on scraping.
NB! Currently a few built-in metrics that require some state to be stored between scrapes, e.g. the “change_events” metric, will currently be ignored. Also non-numeric data columns will be ignored! Tag columns will be preserved though as Prometheus “labels”.
AWS / Azure / GCE support
Due to popularity of various managed PostgreSQL offerings there’s also support for some managed options in sense of Preset Configs, that take into account the fact that on such platforms you get a limited user that doesn’t have access to all metrics or some features have just been plain removed. Thus to reduce server log errors and save time on experimenting there are following presets available:
aws - for standard AWS RDS managed PostgreSQL databases
aurora - for AWS Aurora managed PostgreSQL service
azure - for Azure Database for PostgreSQL managed databases
gce - for Google Cloud SQL for PostgreSQL managed databases