Attention
This documentation pertains to older v2.x releases. Many features and functions have since been updated or replaced. Please refer to the current version for the latest information.
Preparing databases for monitoring
Effects of monitoring
Although the “Observer effect” applies also for pgwatch2, no noticeable impact for the monitored DB is expected when using Preset configs settings, and given that there is some normal load on the server anyways and the DB doesn’t have thousands of tables. For some metrics though can happen that the metric reading query (notably “stat_statements” and “table_stats”) takes some tens of milliseconds, which might be more than an average application query.
At any time maximally 2 metric fetching queries can run in parallel on any monitored DBs. This can be changed by recompiling (MAX_PG_CONNECTIONS_PER_MONITORED_DB variable) the gatherer.
Default Postgres statement timeout is 5s for entries inserted via the Web UI / database directly.
Basic preparations
As a base requirement you’ll need a login user (non-superuser suggested) for connecting to your server and fetching metrics.
Though theoretically you can use any username you like, but if not using “pgwatch2” you need to adjust the “helper” creation SQL scripts (see below for explanation) accordingly, as in those by default the “pgwatch2” will be granted execute privileges.
CREATE ROLE pgwatch2 WITH LOGIN PASSWORD 'secret';
-- NB! For critical databases it might make sense to ensure that the user account
-- used for monitoring can only open a limited number of connections
-- (there are according checks in code, but multiple instances might be launched)
ALTER ROLE pgwatch2 CONNECTION LIMIT 3;
GRANT pg_monitor TO pgwatch2;   // v10+
GRANT CONNECT ON DATABASE mydb TO pgwatch2;
GRANT USAGE ON SCHEMA public TO pgwatch2; -- NB! pgwatch doesn't necessarily require using the public schema though!
GRANT EXECUTE ON FUNCTION pg_stat_file(text) to pgwatch2; -- needed by the wal_size metric
GRANT EXECUTE ON FUNCTION pg_stat_file(text, boolean) to pgwatch2; -- some sqls are calling pg_stat_file('postmaster.pid', true)
For most monitored databases it’s extremely beneficial (to troubleshooting performance issues) to also activate the pg_stat_statements extension which will give us exact “per query” performance aggregates and also enables to calculate how many queries are executed per second for example. In pgwatch2 context it powers the “Stat statements Top” dashboard and many other panels of other dashboards. For additional troubleshooting benefits also the track_io_timing setting should be enabled.
Make sure the Postgres contrib package is installed (should be installed automatically together with the Postgres server package on Debian based systems).
On RedHat / Centos:
yum install -y postgresqlXY-contribOn Debian / Ubuntu:
apt install postgresql-contrib
Add pg_stat_statements to your server config (postgresql.conf) and restart the server.
shared_preload_libraries = 'pg_stat_statements'
track_io_timing = on
After restarting activate the extension in the monitored DB. Assumes Postgres superuser.
psql -c "CREATE EXTENSION IF NOT EXISTS pg_stat_statements"
Rolling out helper functions
Helper functions in pgwatch2 context are standard Postgres stored procedures, running under SECURITY DEFINER privileges. Via such wrapper functions one can do controlled privilege escalation - i.e. to give access to protected Postgres metrics (like active session details, “per query” statistics) or even OS-level metrics, to normal unprivileged users, like the pgwatch2 monitoring role.
If using a superuser login (recommended only for local “push” setups) you have full access to all Postgres metrics and would need helpers only for OS remote statistics. For local (push) setups as of pgwatch2 version 1.8.4 the most typical OS metrics are covered by the “–direct-os-stats” flag, explained below.
For unprivileged monitoring users it is highly recommended to take these additional steps on the “to be monitored” database to get maximum value out of pgwatch2 in the long run. Without these additional steps, you lose though about 10-15% of built-in metrics, which might not be too tragical nevertheless. For that use case there’s also a preset config named “unprivileged”.
NB! When monitoring v10+ servers then the built-in pg_monitor system role is recommended for the monitoring user, which almost substitutes superuser privileges for monitoring purposes in a safe way.
Rolling out common helpers
For completely unprivileged monitoring users the following helpers are recommended to make good use of the default “exhaustive” Preset Config:
export PGUSER=superuser
psql -f /etc/pgwatch2/metrics/00_helpers/get_stat_activity/$pgver/metric.sql mydb
psql -f /etc/pgwatch2/metrics/00_helpers/get_stat_replication/$pgver/metric.sql mydb
psql -f /etc/pgwatch2/metrics/00_helpers/get_wal_size/$pgver/metric.sql mydb
psql -f /etc/pgwatch2/metrics/00_helpers/get_stat_statements/$pgver/metric.sql mydb
psql -f /etc/pgwatch2/metrics/00_helpers/get_sequences/$pgver/metric.sql mydb
NB! Note that there might not be an exact Postgres version match for helper definitions - then replace $pgver with the previous available version number below your server’s Postgres version number.
NB! Also note that as of v1.8.1 some helpers definition SQL-s scripts (like for “get_stat_statements”) will inspect also the “search_path” and by default will not install into schemas that have PUBLIC CREATE privileges, like the “public” schema by default has!
Also when rolling out helpers make sure the search_path is at defaults or set so that it’s also accessible for the monitoring role as currently neither helpers nor metric definition SQL-s don’t assume any particualar schema and depend on the search_path including everything needed.
For more detailed statistics (OS monitoring, table bloat, WAL size, etc) it is recommended to install also all other helpers found from the /etc/pgwatch2/metrics/00_helpers folder or do it automatically by using the rollout_helper.py script found in the 00_helpers folder.
As of v1.6.0 though helpers are not needed for Postgres-native metrics (e.g. WAL size) if a privileged user (superuser or pg_monitor GRANT) is used, as pgwatch2 now supports having 2 SQL definitions for each metric - “normal / unprivileged” and “privileged” / “superuser”. In the file system /etc/pgwatch2/metrics such “privileged” access definitions will have a “_su” added to the file name.
Automatic rollout of helpers
pgwatch2 can roll out helpers also automatically on the monitored DB. This requires superuser privileges and a configuration attribute for the monitored DB. In YAML config mode it’s called is_superuser, in Config DB md_is_superuser, in the Web UI one can tick the “Auto-create helpers” checkbox and for ad-hoc mode there are the –adhoc-create-helpers / PW2_ADHOC_CREATE_HELPERS flags.
After the automatic rollout it’s still generally recommended to remove the superuser privileges from the monitoring role, which now should have GRANT-s to all automatically created helper functions. Note though that all created helpers will not be immediately usable as some are for special purposes and need additional dependencies.
A hint: if it can be foreseen that a lot of databases will be created on some instance (generally not a good idea though) it might be a good idea to roll out the helpers directly in the template1 database - so that all newly created databases will get them automatically.
PL/Python helpers
PostgreSQL in general is implemented in such a way that it does not know too much about the operation system that it is running on. This is a good thing for portability but can be somewhat limiting for monitoring, especially when there is no system monitoring framework in place or the data is not conveniently accessible together with metrics gathered from Postgres. To overcome this problem, users can also choose to install helpers extracting OS metrics like CPU, RAM usage, etc so that this data is stored together with Postgres-native metrics for easier graphing / correlation / alerting. This also enable to be totally independent of any System Monitoring tools like Zabbix, etc, with the downside that everything is gathered over Postgres connections so that when Postgres is down no OS metrics can be gathered also. Since v1.8.4 though the latter problem can be reduced for local “push” based setups via the “–direct-os-stats” option plus according metrics configuration (e.g. the “full” preset).
Note though that PL/Python is usually disabled by DB-as-a-service providers like AWS RDS for security reasons.
# first install the Python bindings for Postgres
apt install postgresql-plpython3-XY
# yum install postgresqlXY-plpython3

psql -c "CREATE EXTENSION plpython3u"
psql -f /etc/pgwatch2/metrics/00_helpers/get_load_average/9.1/metric.sql mydb

# psutil helpers are only needed when full set of common OS metrics is wanted
apt install python3-psutil
psql -f /etc/pgwatch2/metrics/00_helpers/get_psutil_cpu/9.1/metric.sql mydb
psql -f /etc/pgwatch2/metrics/00_helpers/get_psutil_mem/9.1/metric.sql mydb
psql -f /etc/pgwatch2/metrics/00_helpers/get_psutil_disk/9.1/metric.sql mydb
psql -f /etc/pgwatch2/metrics/00_helpers/get_psutil_disk_io_total/9.1/metric.sql mydb
Note that we’re assuming here that we’re on a modern Linux system with Python 3 as default. For older systems Python 3
might not be an option though, so you need to change plpython3u to plpythonu and also do the same replace inside the
code of the actual helper functions! Here the rollout_helper.py script with it’s --python2 flag can be helpful again.
Notice on using metric fetching helpers
Starting from Postgres v10 helpers are mostly not needed (only for PL/Python ones getting OS statistics) - there are available some special monitoring roles like “pg_monitor”, that are exactly meant to be used for such cases where we want to give access to all Statistics Collector views without any other “superuser behaviour”. See here for documentation on such special system roles. Note that currently most out-of-the-box metrics first rely on the helpers as v10 is relatively new still, and only when fetching fails, direct access with the “Privileged SQL” is tried.
For gathering OS statistics (CPU, IO, disk) there are helpers and metrics provided, based on the “psutil” Python package…but from user reports seems the package behaviour differentiates slightly based on the Linux distro / Kernel version used, so small adjustments might be needed there (e.g. to remove a non-existent column). Minimum usable Kernel version required is 3.3. Also note that SQL helpers functions are currently defined for Python 3, so for older Python 2 you need to change the
LANGUAGE plpython3upart.When running the gatherer locally, i.e. having a “push” based configuration, the metric fetching helpers are not mostly not needed as superuser can be used in a safe way and starting from v1.8.4 one can also enable the –direct-os-stats parameter to signal that we can fetch the data for the default “psutil_*” metrics directly from OS counters. If direct OS fetching fails though, the fallback is still to try via PL/Python wrappers.
In rare cases when some “helpers” have been installed, and when doing a binary PostgreSQL upgrade at some later point in time via pg_upgrade, this could result in error messages thrown. Then just drop those failing helpers on the “to be upgraded” cluster and re-create them after the upgrade process.
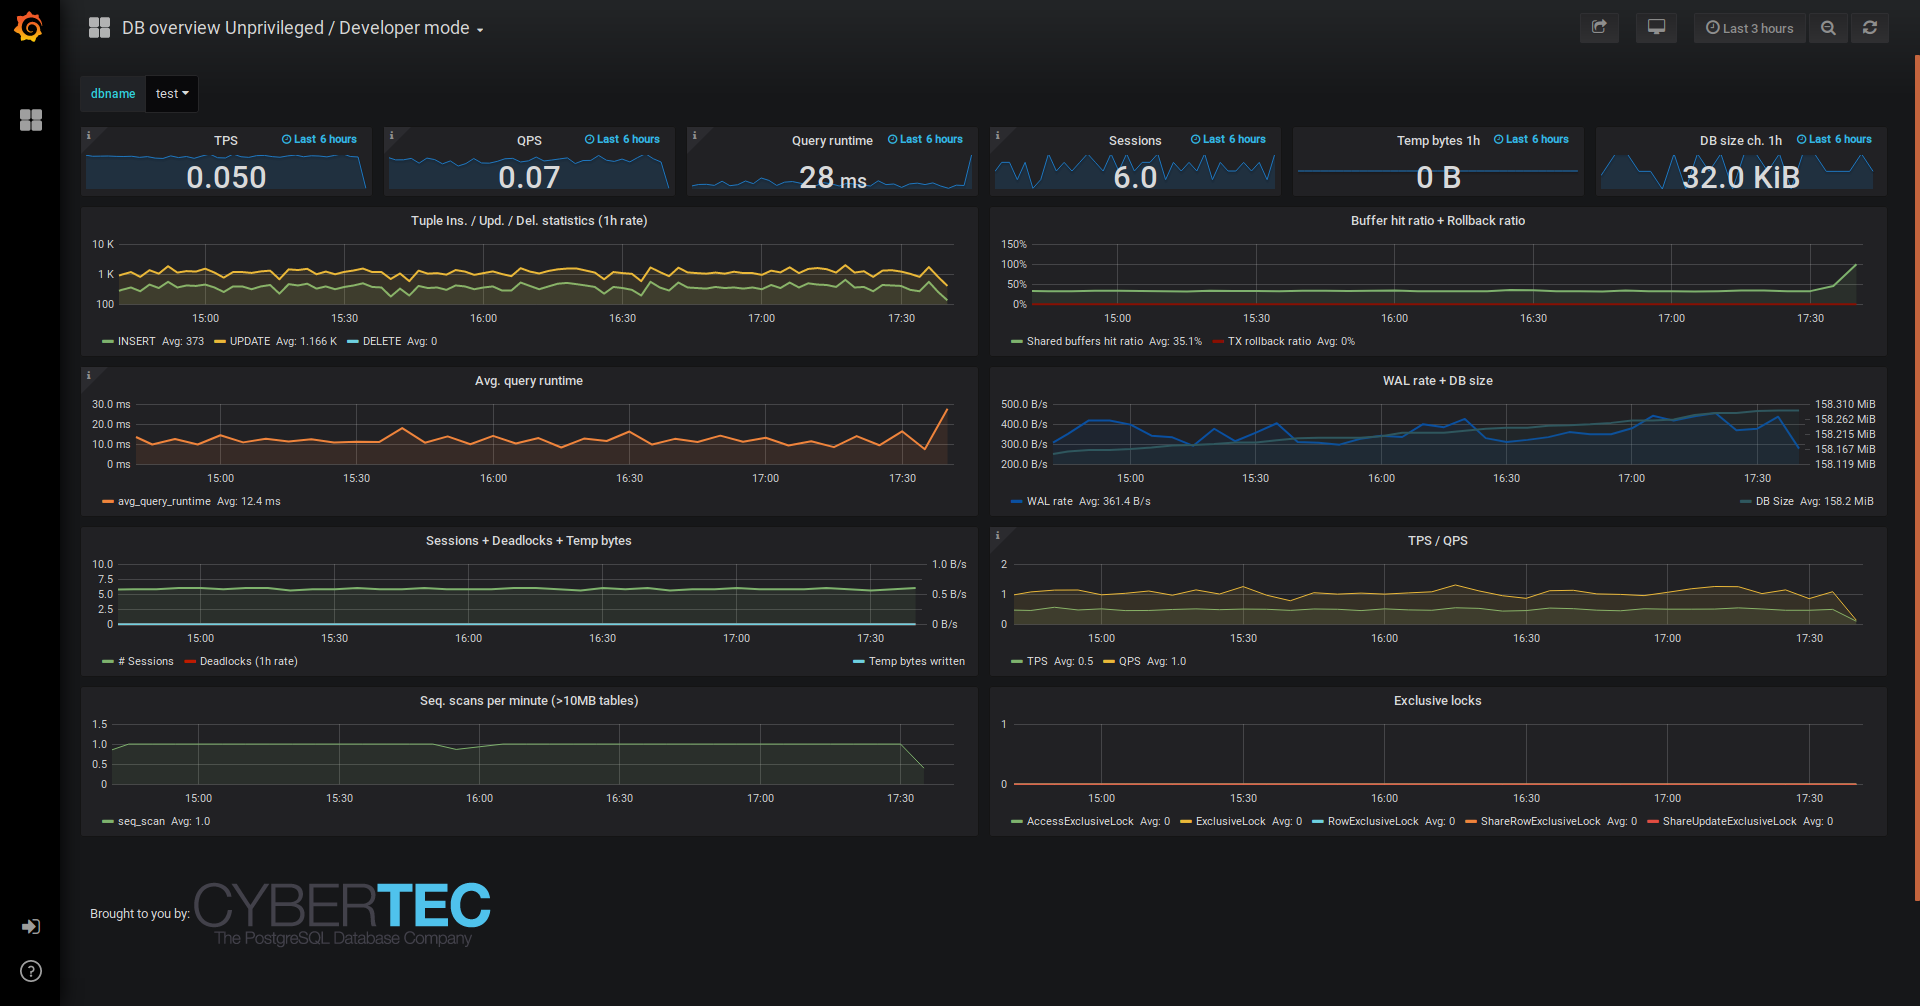
Running with developer credentials
As mentioned above, helper / wrapper functions are not strictly needed, they just provide a bit more information for unprivileged users - thus for developers with no means to install any wrappers as superuser, it’s also possible to benefit from pgwatch2 - for such use cases e.g. the “unprivileged” preset metrics profile and the according “DB overview Unprivileged / Developer” dashboard are a good starting point as it only assumes existence of pg_stat_statements (which should be available by all cloud providers).
Different DB types explained
When adding a new “to be monitored” entry a DB type needs to be selected. Following types are available:
- postgres
Monitor a single database on a single Postgres instance. When using the Web UI and the “DB name” field is left empty, there’s as a one time operation where all non-template DB names are fetched, prefixed with “Unique name” field value and added to monitoring (if not already monitored). Internally monitoring always happens “per DB” not “per cluster” though.
- postgres-continuous-discovery
Monitor a whole (or subset of DB-s) of Postgres cluster / instance. Host information without a DB name needs to be specified and then the pgwatch2 daemon will periodically scan the cluster and add any found and not yet monitored DBs to monitoring. In this mode it’s also possible to specify regular expressions to include/exclude some database names.
- pgbouncer
Use to track metrics from PgBouncer’s “SHOW STATS” command. In place of the Postgres “DB name” the name of the PgBouncer “pool” to be monitored must be inserted.
- pgpool
Use to track joint metrics from Pgpool2’s SHOW POOL_NODES and POOL_PROCESSES commands. Pgpool2 from version 3.0 is supported.
- patroni
Patroni is a HA / cluster manager for Postgres that relies on a DCS (Distributed Consensus Store) to store it’s state. Typically in such a setup the nodes come and go and also it should not matter who is currently the master. To make it easier to monitor such dynamic constellations pgwatch2 supports reading of cluster node info from all supported DCS-s (etcd, Zookeeper, Consul), but currently only for simpler cases with no security applied (which is actually the common case in a trusted environment).
- patroni-continuous-discovery
As normal patroni DB type but all DB-s (or only those matching the regex if any provided) are monitored.
- patroni-namespace-discovery
Similar to patroni-continuous-discovery but all Patroni scopes (clusters) of an ETCD namespace are automatically monitored. Optionally regexes on database names still apply if provided.
NB! All “continuous” modes expect access to “template1” or “postgres” databasess of the specified cluster to determine the database names residing there.